Multifamily underwriting software case studyRaw listings became cap rates automatically, with incomplete deals held back and explained.
An investment firm needed to evaluate multifamily properties at scale without slow, error-prone manual underwriting.
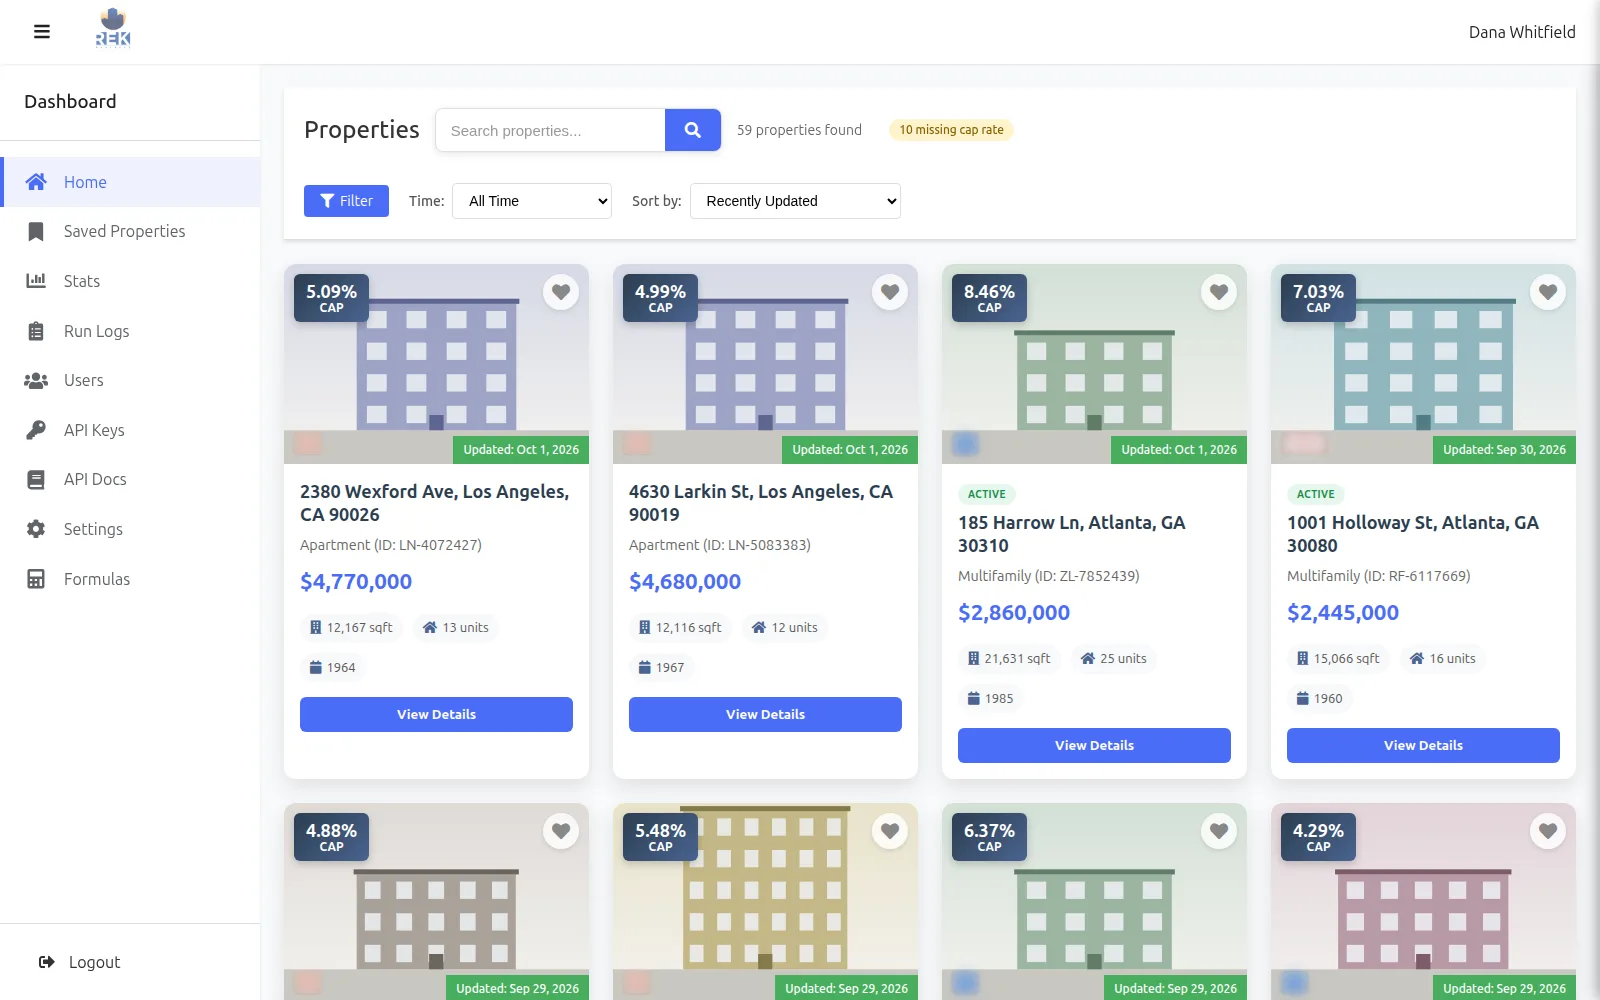
The real product, shown with demo data.
A real-estate investment firm needed to evaluate multifamily properties at scale. I built a platform that collects property data on a schedule, enriches it with market rents and public records, and computes NOI and cap rate from a regional expense model — and gives no number at all when the inputs are incomplete.
Underwriting by hand was slow and error-prone.
A real-estate investment firm needed to evaluate multifamily properties at scale. Manually pulling listings, rents, and public records, then running the underwriting math, was slow and error-prone.
A wrong cap rate means a bad investment.
The data lives behind anti-bot defenses and in inconsistent formats, and the financial model has to be exactly right. So it needed reliable data collection and correct, region-aware financial calculation.
From raw listing to investment metric, automatically.
A platform that automatically collects property data on a schedule, enriches each property with market rents and public records, classifies and analyzes it with AI, and computes investment metrics — surfaced in a dashboard with filtering and sorting, where every figure can be opened to see the calculation behind it.
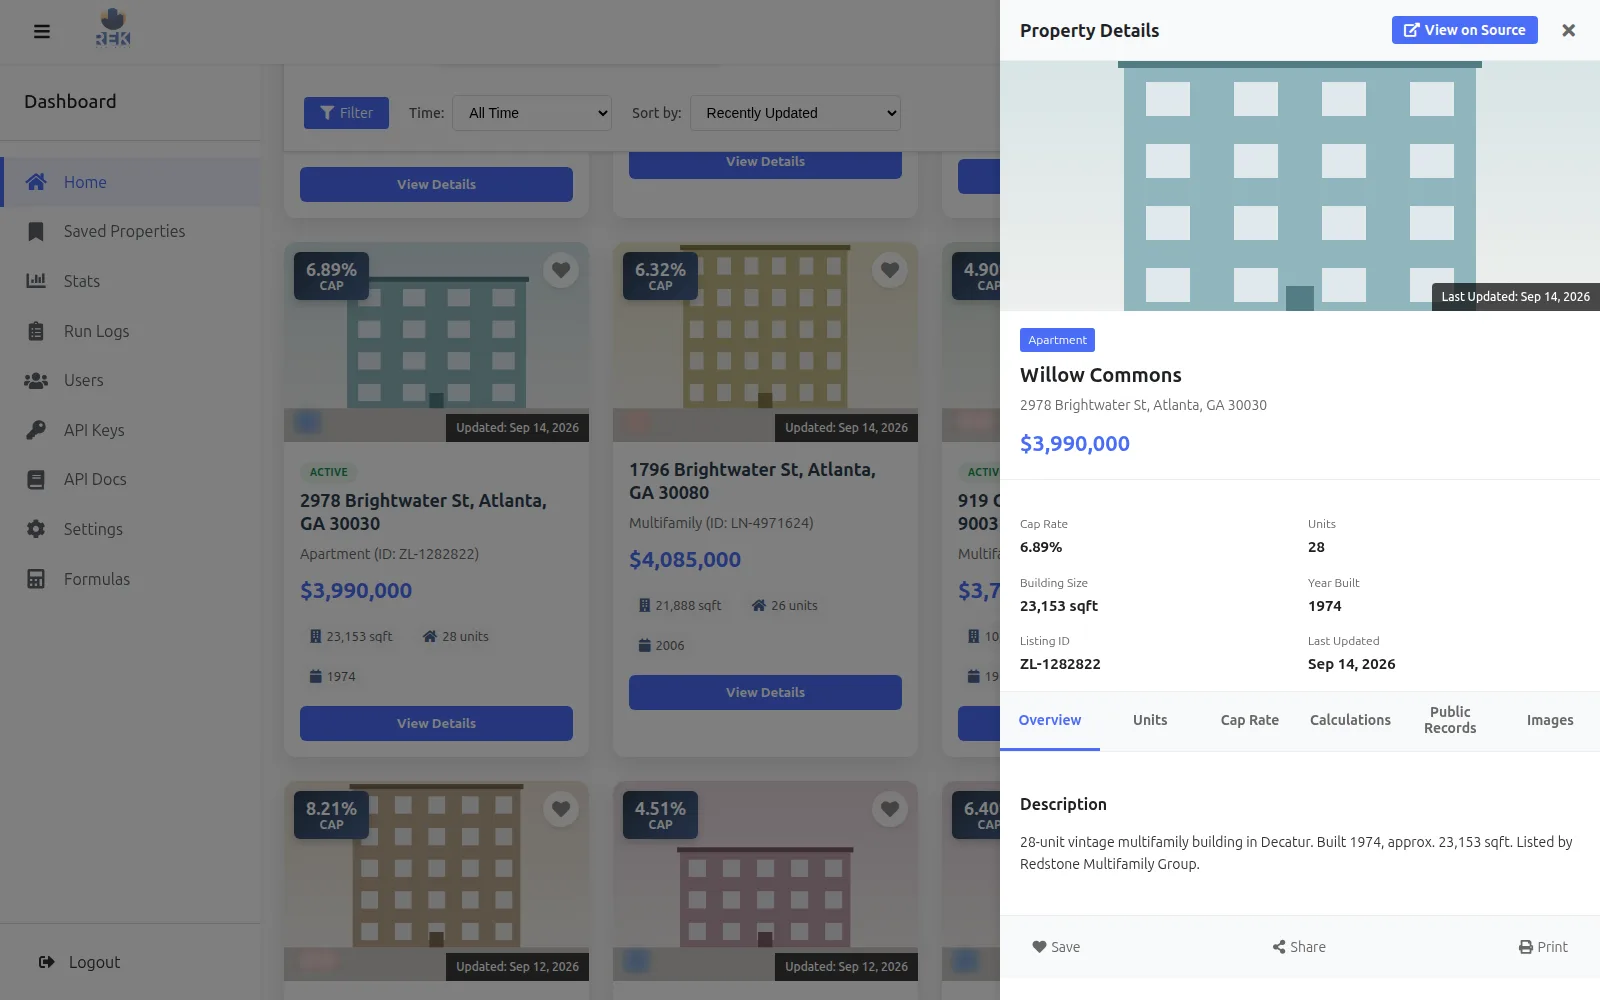
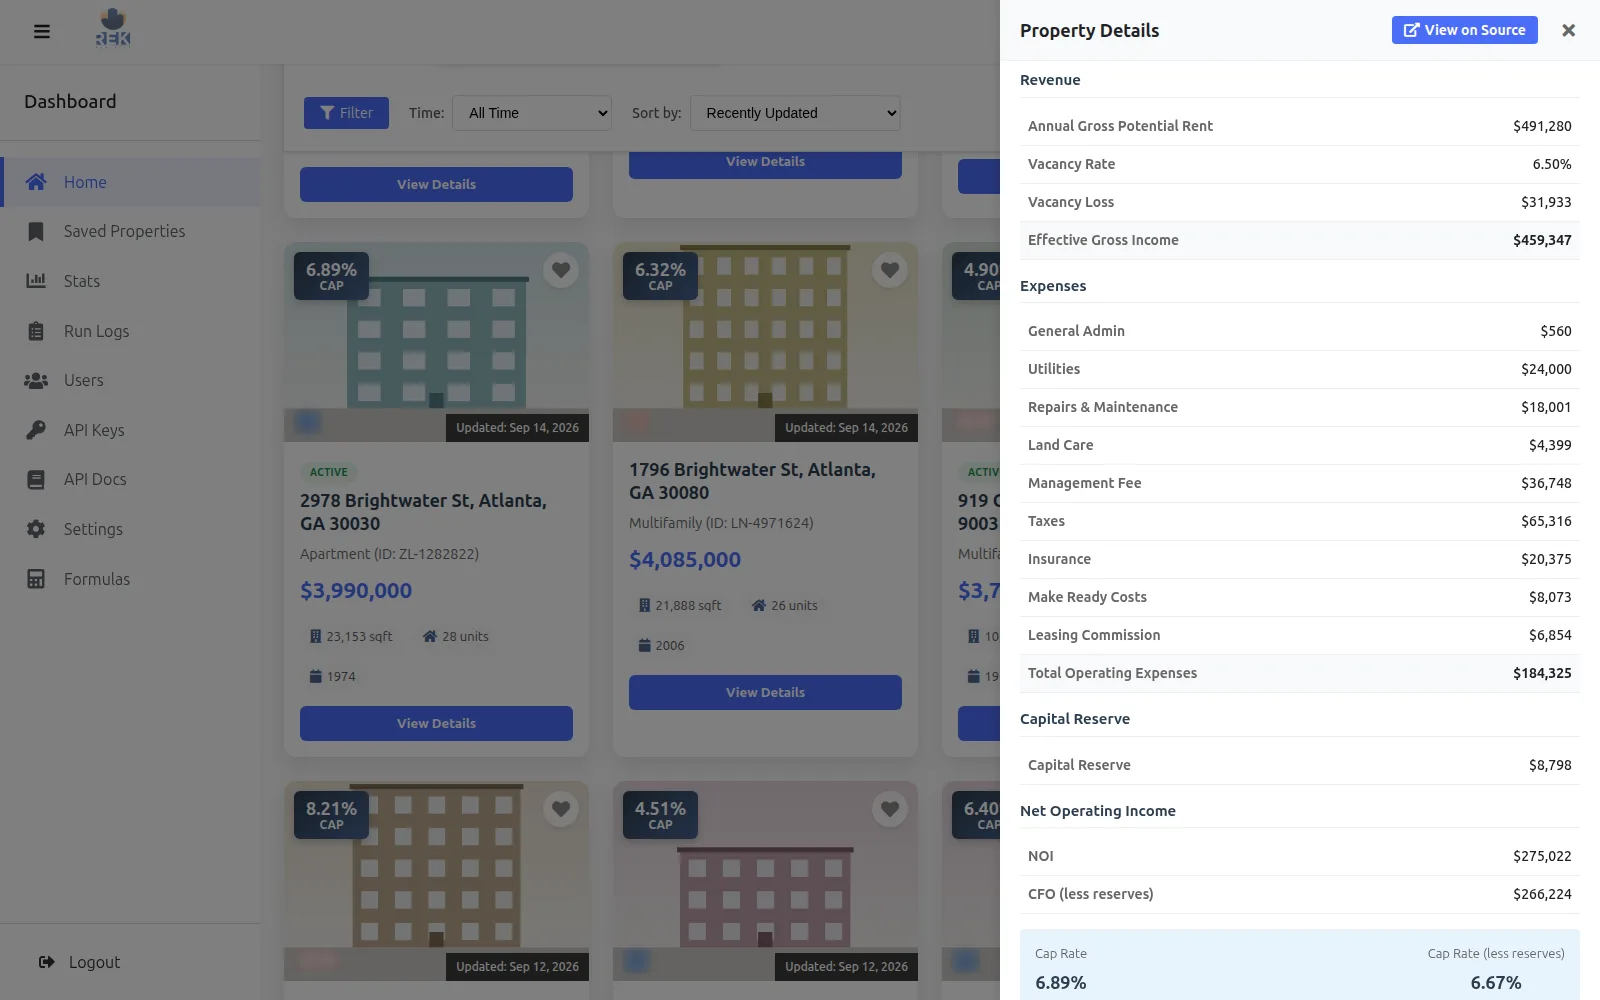
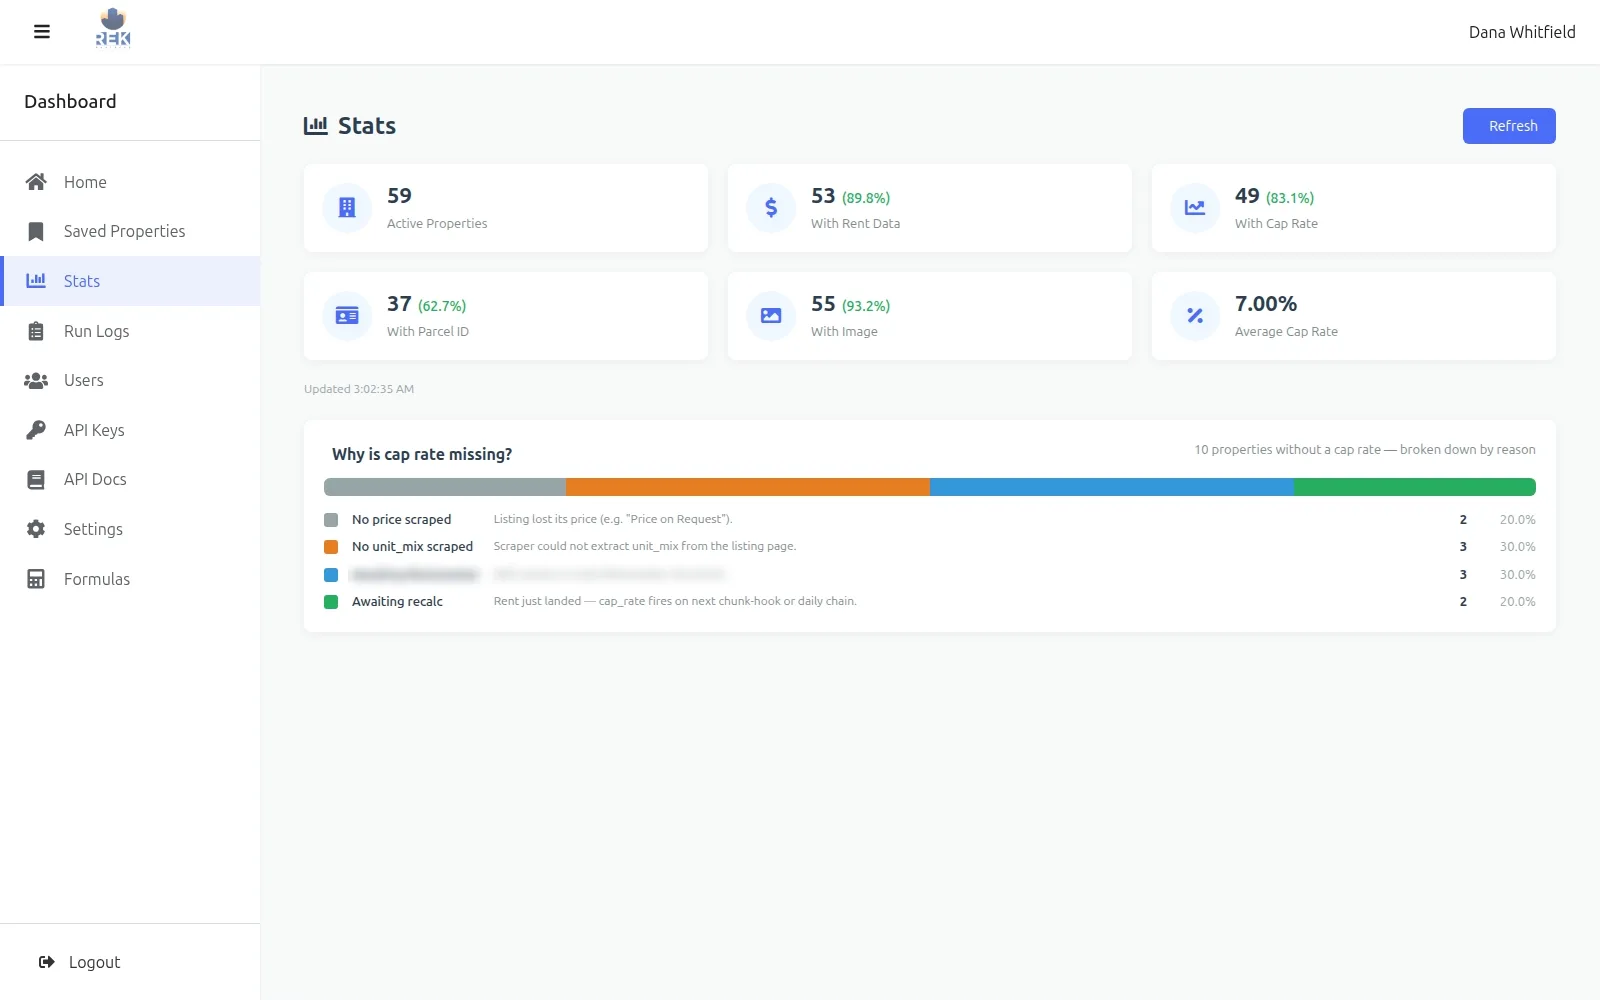
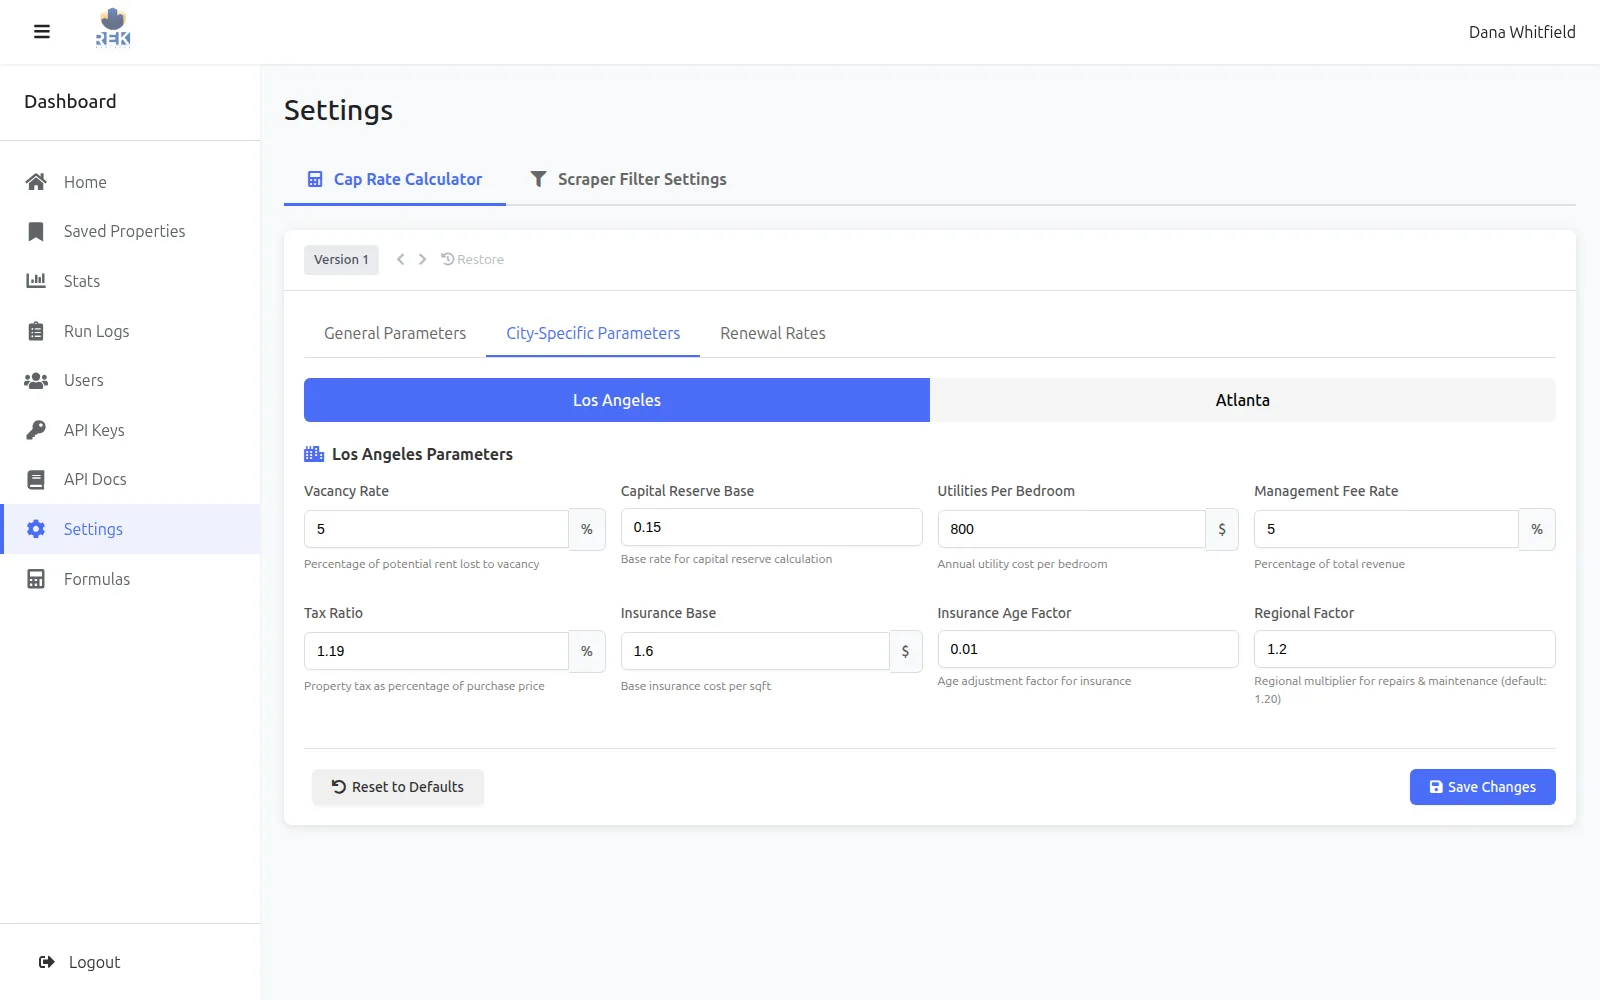
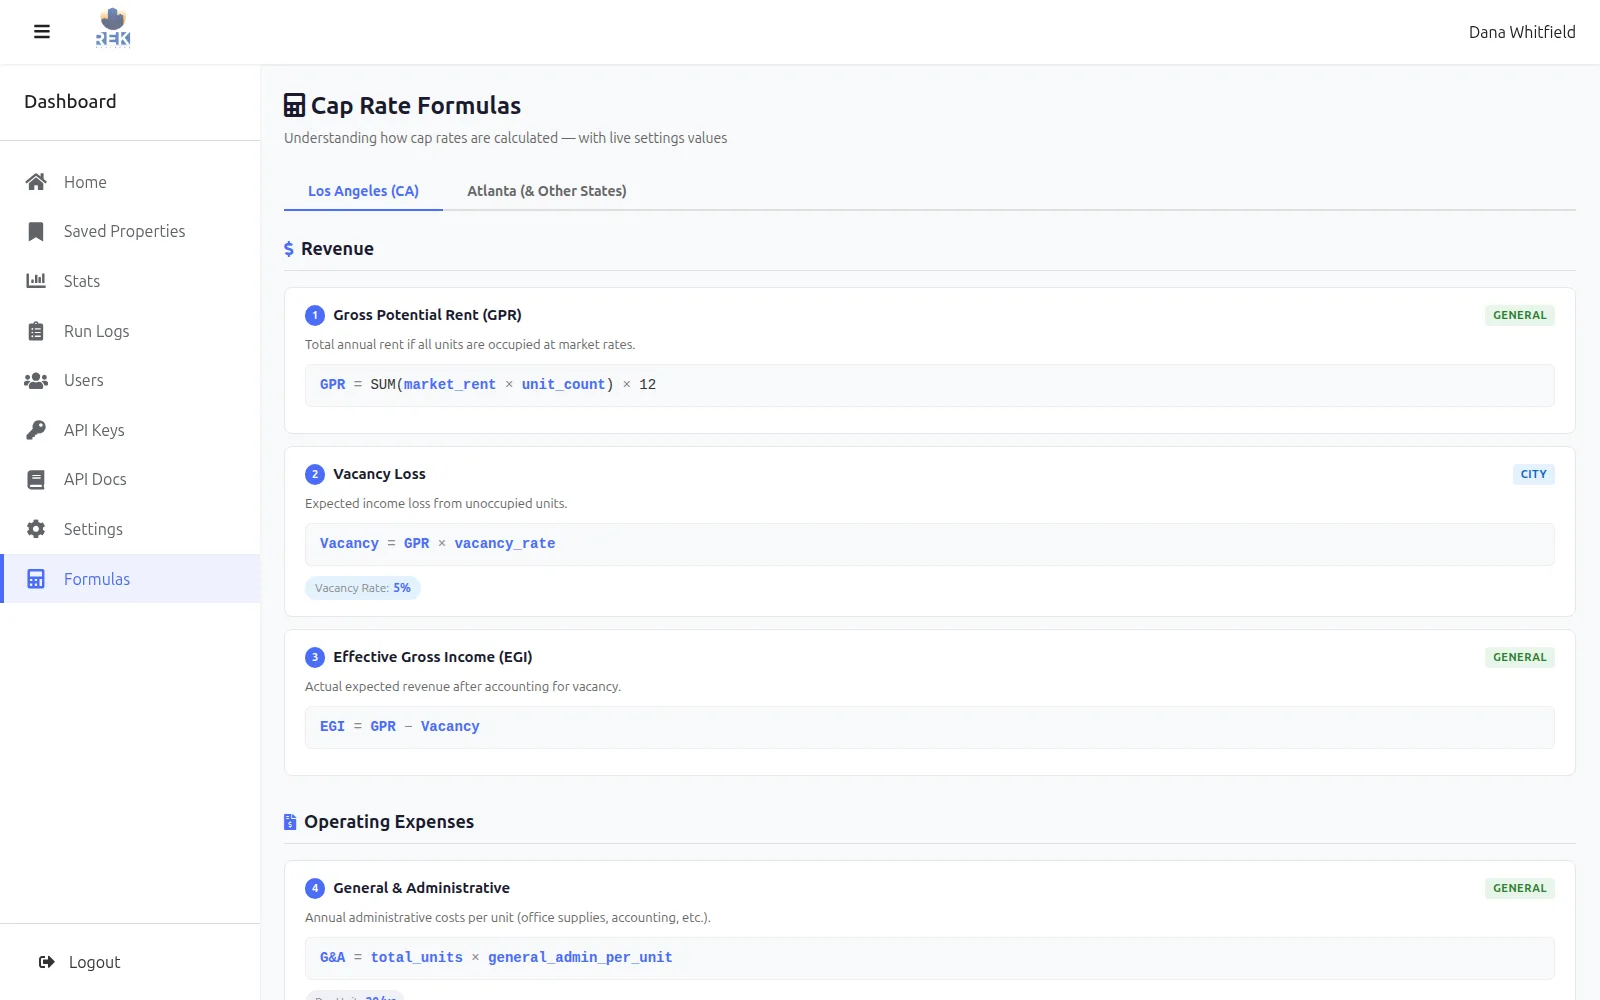
Screens from the real product, captured with demo data. No client or customer data is shown.
A scheduled underwriting pipeline
- 01CollectListings behind anti-bot defenses
- 02EnrichMarket rents + public records
- 03AIClassifyProperty type from images, details from text
- 04Cap-rate engineNOI from a region-specific expense model
- 05Completeness checkNo price, units or rents: no cap rate
- 06DashboardFilter, sort, review
Reliable data, correct math.
Resilient scraping
Survives anti-bot systems and changing page structures, with retries and monitoring that surface collection failures.
AI used precisely
Image-based property-type classification, plus extraction of unit counts, square footage and key details from listing text.
Cap-rate engine
Per-unit market rents fed into an engine that computes NOI and cap rate from a detailed, region-specific expense model.
No guessed numbers
A listing with no price, no unit mix or no rents gets no cap rate, and the stats page says which reason applies — instead of a figure that looks right and is not.
Change detection
Each run re-fetches only listings that are new or whose price or status changed. That skips about 90% of them, which is why the schedule moved from daily to weekly.
The calls that shaped the build
Operating expenses differ by region. A single national assumption would produce cap rates that look right but lead to bad investment decisions.
Only where it adds something rules can’t: classifying property type from images and pulling unit counts, square footage and key details from listing text.
A wrong number is worse than no number. When a listing has no price, no unit mix or no rents, the platform shows no cap rate and says which input is missing, instead of silently skewing the results.